With the shelter-in-place order in the San Francisco Bay Area extending until at least May 1, millions of people continue to stay home to slow the spread of COVID-19. Just two weeks into what is now expected to last at least six weeks, there are indications that social distancing is indeed flattening the curve and slowing an influx of patients that might otherwise have overwhelmed Bay Area hospitals.
This swift collective action may be saving lives in more ways than one. The dropoff in traffic and commercial activities is also impacting the air we breathe. Researchers are uncovering a link between air pollution exposure and the spread of COVID-19. And the World Health Organization estimates seven million people die each year from air pollution.
In response to requests from customers, partners, and researchers, our scientists are compiling and analyzing the changes in air pollutant and greenhouse gas levels correlated with this massive shift. Last week, we reported that levels of all but one air pollutant had dropped significantly in the Bay Area in comparison to 2017–2019 averages.
With the shelter-in-place now firmly established, we saw even bigger drops in average pollutant levels (other than ozone) in comparison to the averages from 2017–19 in those two weeks, on weekdays.
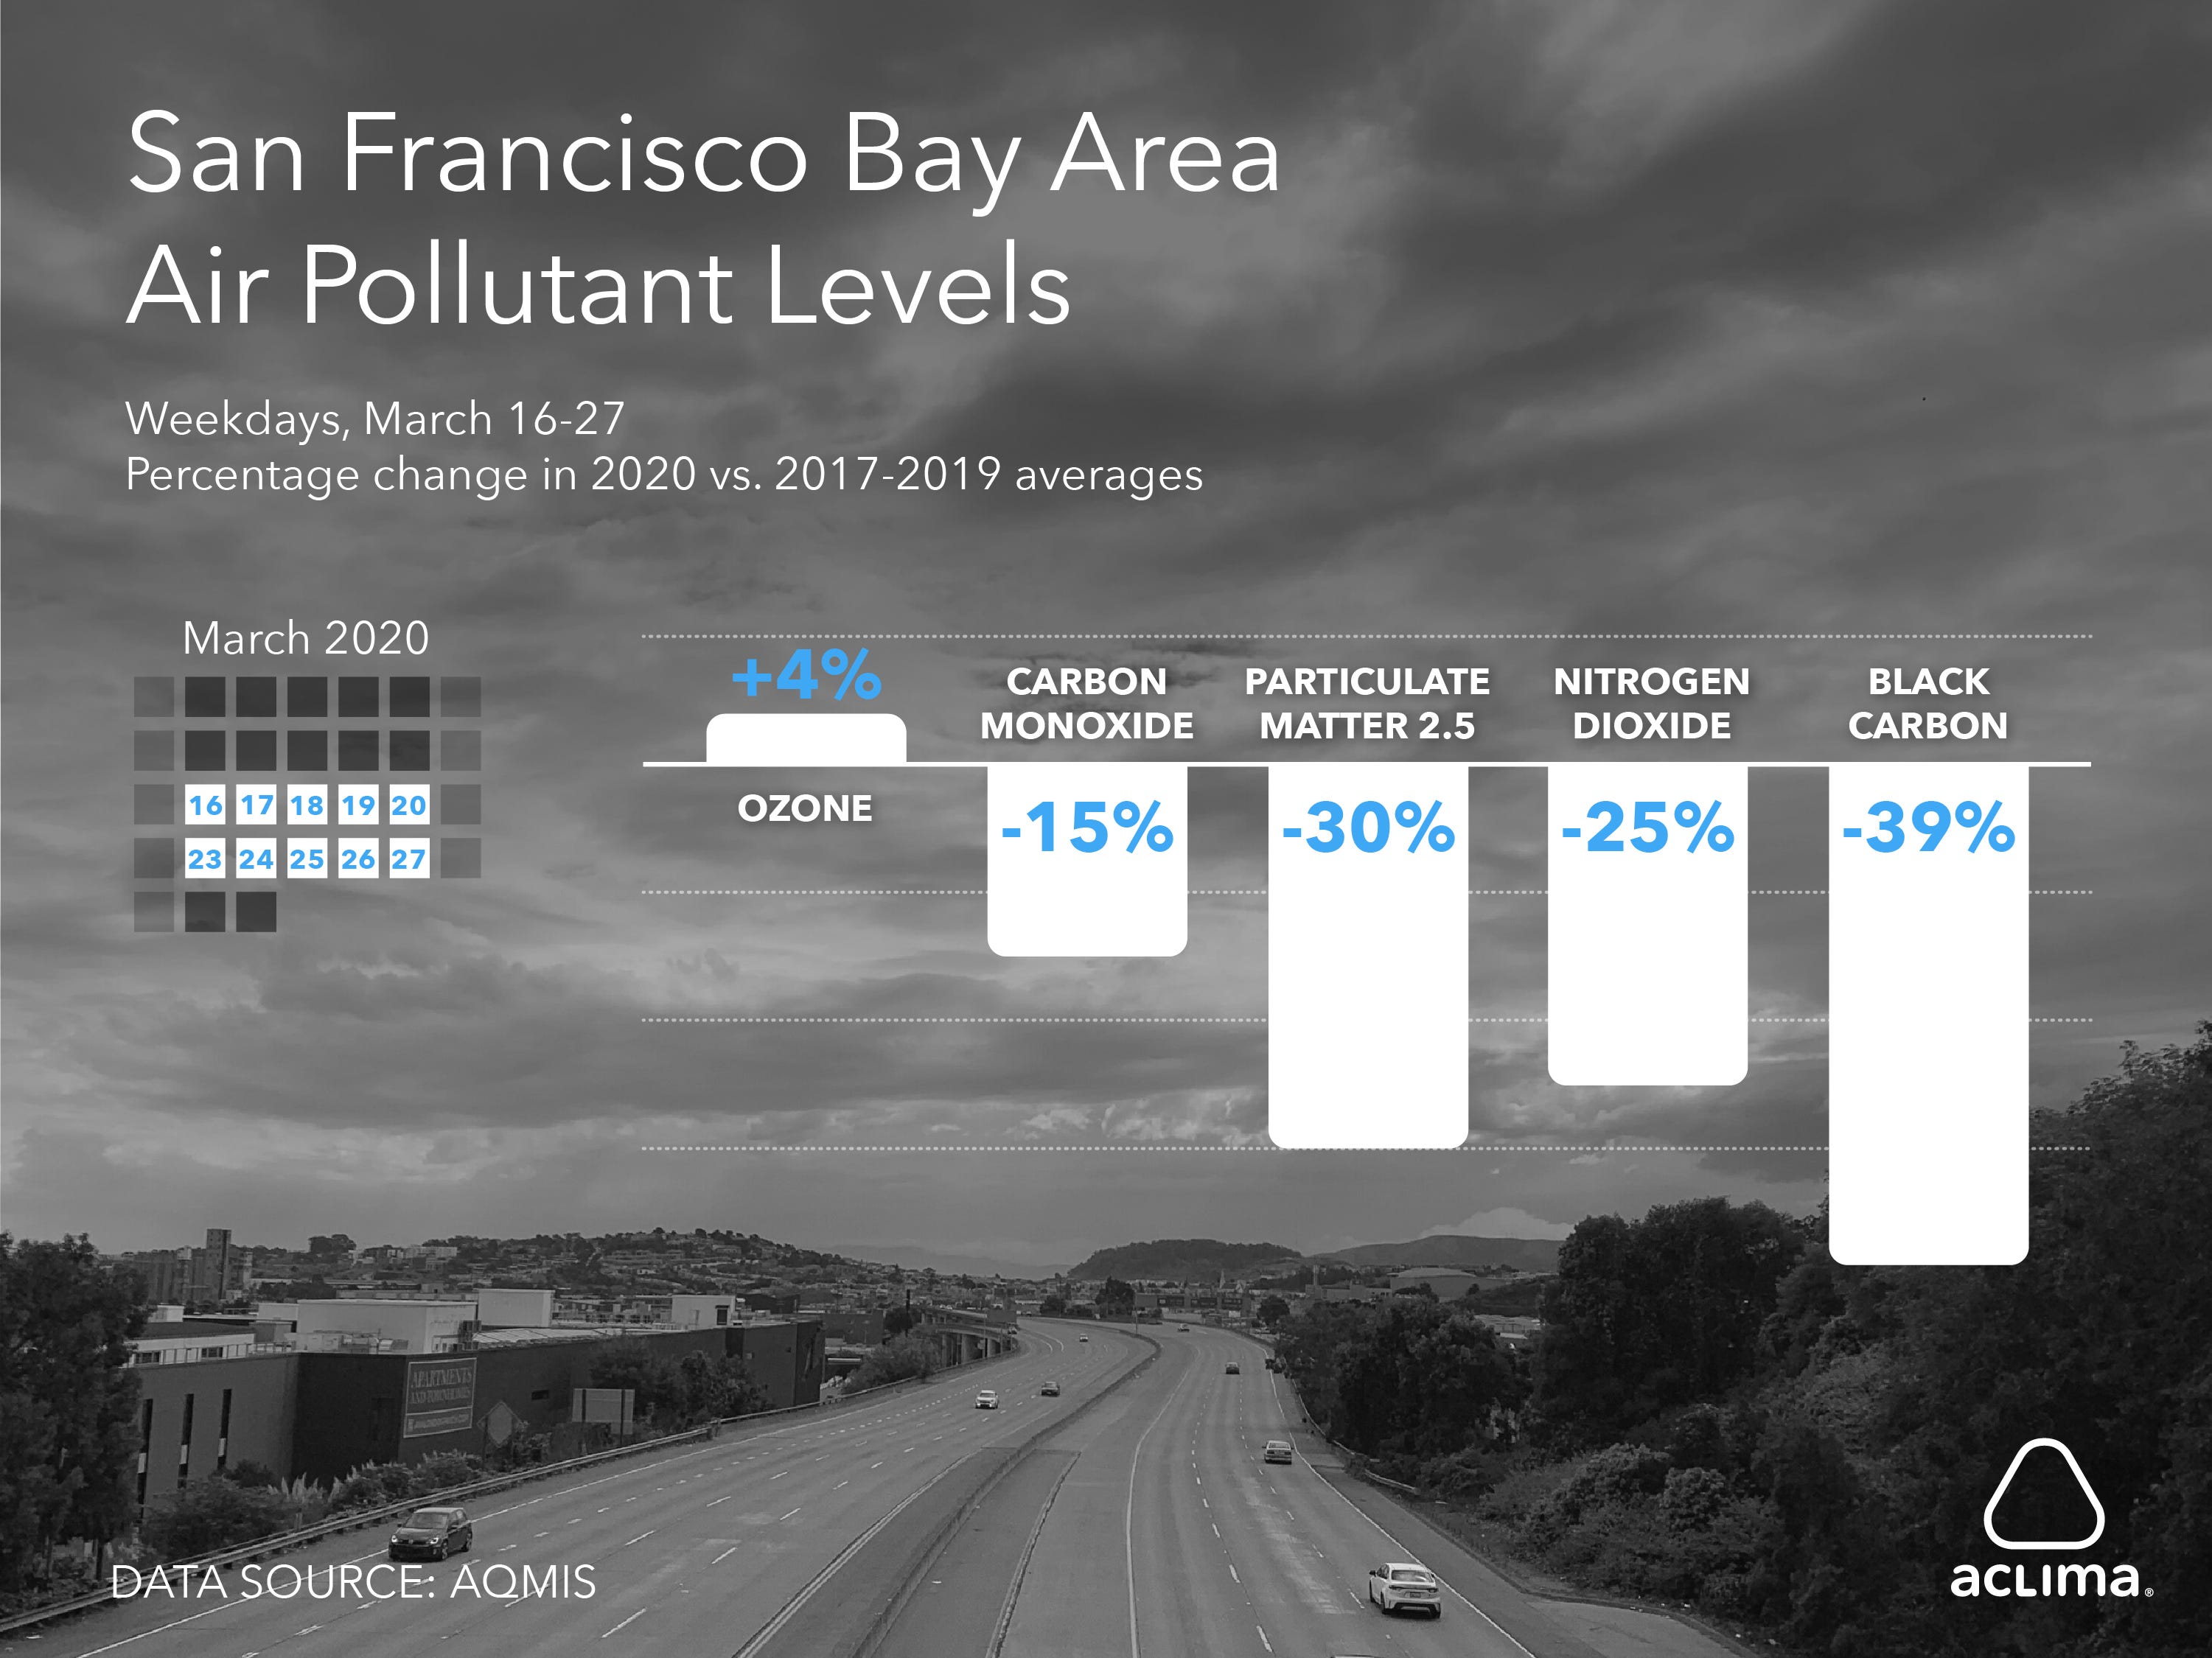
Comparing changes from average pollutant levels on weekdays March 9–20, as reported last week when the Bay Area was transitioning to shelter-in-place, to March 16–27, the first two weeks of shelter-in-place, NO₂ went from 20% lower to 25%, PM₂.₅ went from 16% to 30% lower, and Black Carbon dropped most significantly from 29% to 39% lower than previous years’ averages for the same timeframe. Carbon monoxide (CO) stayed almost steady with 16% vs. 15% average drops in the two timeframes.
Weakening Weekend Effect as Percent Changes in Ozone Fall from +11% to +4%
Notably, the increase in ozone (O₃) observed last week at 11% above previous years’ averages fell to just 4% above previous years’ averages, indicating a potential weakening of the Weekend Effect that can be triggered by declining NOx levels. With O₃ controlled more strongly by regional background effects this time of year, rather than from local emissions sources, it is likely that average O₃ levels will not decrease substantially during the shelter-in-place time period. If this shelter-in-place extends further into spring and summer when the warmer weather provides more favorable conditions for the production of O₃, we may be able to learn about how reductions in mobile emissions impact O₃ concentrations during the time of year when California typically experiences its most severe O₃ pollution events.
CO₂ in West Oakland Drops Further, Faster Compared to Region and Coast
The Aclima mobile sensing network measures hyperlocal pollutants and greenhouse gases in every county of the Bay Area every day and night. Using this spatially resolved data, we determined the average daily CO₂ levels in the Bay Area and compared them with averaged hyperlocal data measured at the coastal zone of the Bay Area and in West Oakland, as well as with baseline levels at Mauna Loa (Hawaii) from February 7 to March 27. The Mauna Loa observatory provides a reference on background CO₂ levels, which have been measured continuously at the site since 1958, starting with the work of Charles Keeling.
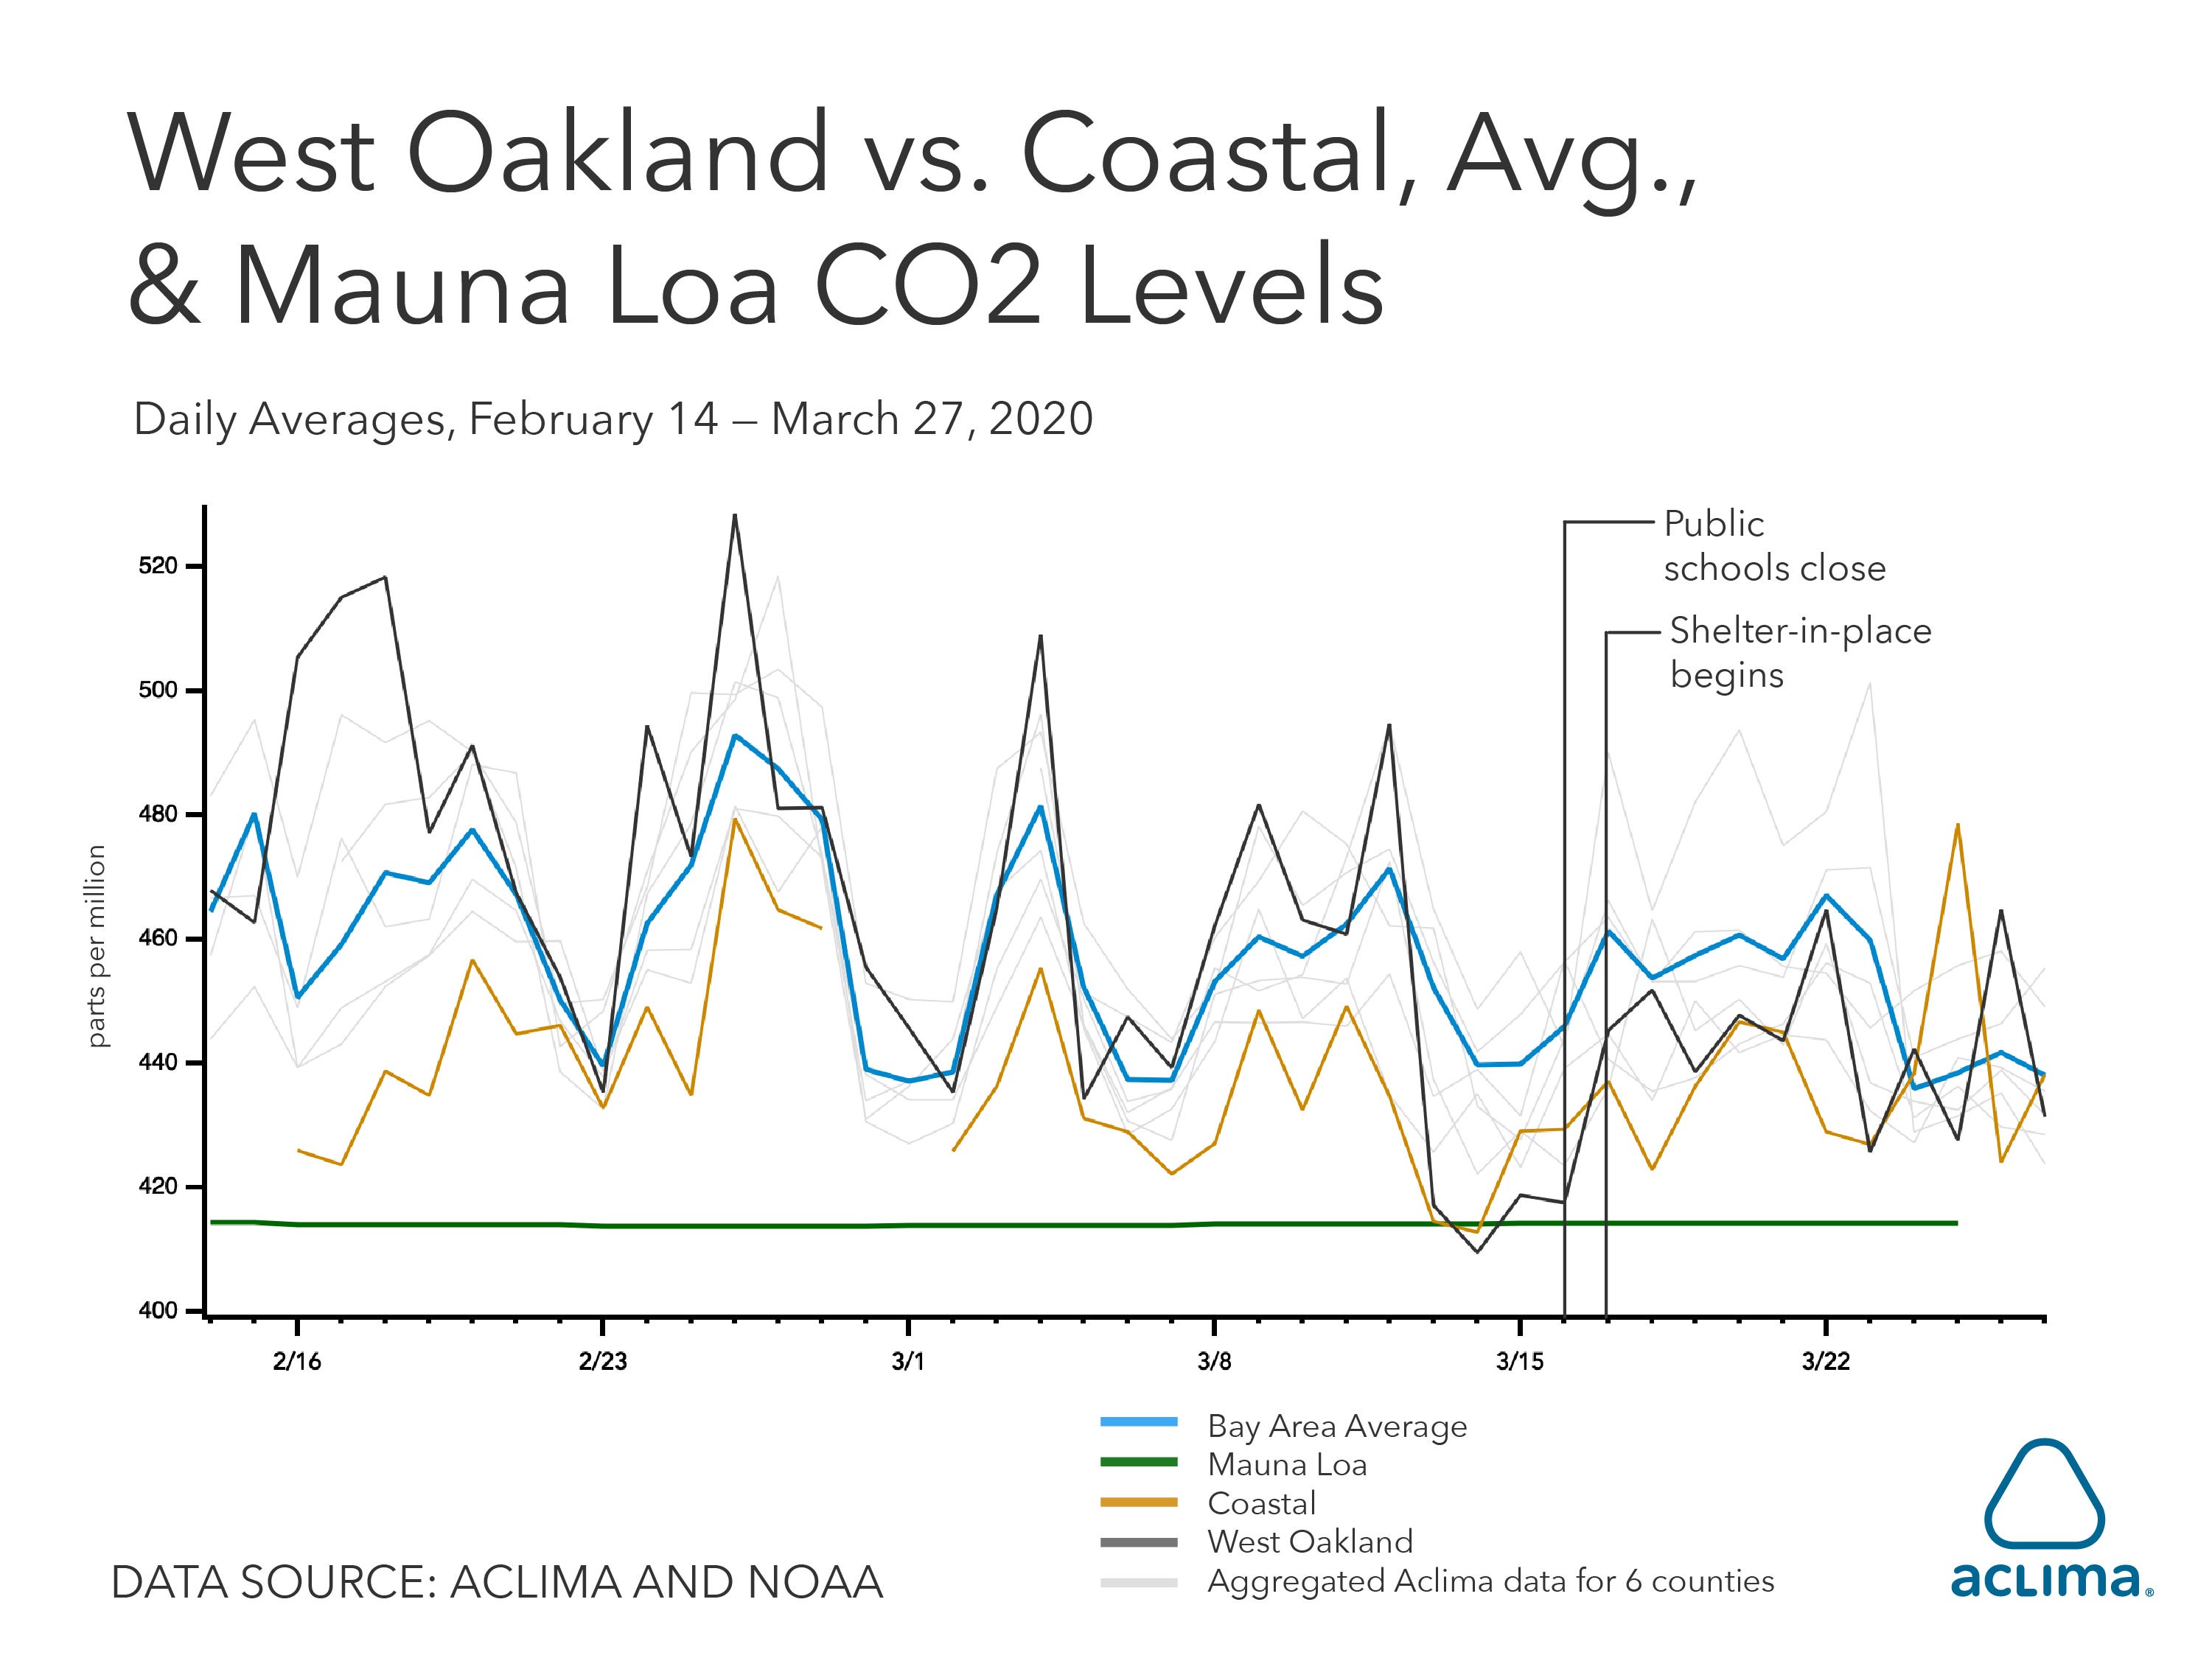
We observed differences in levels of carbon dioxide (CO₂) on the coast of the Bay Area as compared to West Oakland, the Bay Area average, and the background concentration levels on Mauna Loa. Up until early March, weekday West Oakland CO₂ levels were nearly always above the regional average whereas coastal levels were below average. On March 14, West Oakland levels drop sharply, briefly dipping to around the Northern Hemispheric background concentrations observed at Mauna Loa. Starting March 16, as Oakland public schools closed and the Bay Area-wide shelter-in-place order was given, West Oakland levels of CO₂ appear to stay nearly always below average. West Oakland CO₂ levels have also been tracking at around the same levels as at the coast, which was previously only the case on the weekends during the time period shown. And inversely, coastal levels have stayed relatively constant with occasional spikes above average.
We have been measuring hyperlocal air quality in West Oakland in partnership with the West Oakland Environmental Indicators Project, a community-driven environmental justice organization, since 2015. That initial work led to the discovery that air pollution can persistently vary by 5–8x from one end of a block to another, published in the peer-reviewed journal Environmental Science & Technology in 2017. Today we’re mapping hyperlocal air quality on every block in the Bay Area, including throughout West Oakland, measuring in all nine counties 24/7.
Varying Factors Impacting CO₂ Concentrations
CO₂ concentrations measured by the Aclima fleet are impacted by a number of factors including:
-
Global background concentrations which have been increasing by 2+ ppm per year (Source: NOAA)
-
Local ecosystem-atmosphere exchange of CO₂ which can increase or decrease CO₂ depending on the time of day, season, and other factors e.g. urban canopy
-
Emissions from local combustion sources (vehicles, power plants, etc.)
-
Local meteorological controls over the rate of dilution of emitted CO₂
In order to study the local sources and sinks of CO₂ in the atmosphere, researchers often work with CO₂ concentration enhancements (or increases) above the global background concentration as observed at a remote site like the Mauna Loa Observatory.
Therefore, in order to understand the impact of the Bay Area shelter-in-place order on local CO₂ emissions, we analyzed the decreases in the CO₂ enhancement after the shelter-in-place order began. We observe a 40% decrease in the CO₂ enhancement on weekdays and a 25% decrease across all days of the week. It is important to note that translating changes in concentration to specific reductions in emissions sources requires additional analysis.
Isolating the impact of combustion emissions vs. the influence of the ecosystem influence presents a further challenge in interpreting CO₂ concentration measurements. Researchers use a number of strategies such as isotope-specific measurements, ecosystem modeling, day-of-week or time-of-day differences, multi-pollutant analyses, and inverse modeling (among other strategies) to discern the differences. Aclima’s hyperlocal and multipollutant measurements help unlock analyses that tease out these influences. We will be sharing more insights as we dive deeper into the data in the coming weeks.
With the unprecedented change in human activity that has been happening over the last few weeks, and the simultaneous observation of decreases in multiple combustion-related pollutants (NO₂, PM₂.₅, CO, BC), it is likely that the observed CO₂ decrease is related to reduced traffic over this time period. However, a more detailed analysis will be required to precisely quantify the effect of shelter-in-place on emissions.
Flattening the CO₂ Curve
As lockdowns and other COVID-19 responses reduce traffic and commercial activity around the planet, how will this impact the global growth of CO₂ in the atmosphere and projections for future climate change? By observing near-source reductions in CO₂, we can begin to imagine how large-scale reductions in emissions could slow the ~2 ppm growth rate of global background concentrations that drives warming through a stronger greenhouse gas effect. According to Ralph Keeling of the Scripps Institute of Oceanography, there would need to be a 10% decrease in fossil CO₂ emissions globally, sustained over 1 year, for there to be a perceptible change observed in the record at Mauna Loa. For comparison, the 2008 global financial crisis resulted in a 1.4% decrease in fossil fuel emissions globally compared to prior years, which was more than made up for by accelerated growth in the following years.
Since the atmospheric lifetime of CO₂ is estimated to be between 100–300 years (IPCC), much of the CO₂ emitted since the beginning of the industrial era remains in the atmosphere, and even though we are seeing this current significant decrease in the concentration of CO₂ in the Bay Area, this does not mean that the global background CO₂ concentration and the present magnitude of the greenhouse effect due to human-caused CO₂ will show much decrease, if at all. Regardless, Aclima measurements of CO₂ (and other urban CO₂ networks) are uncovering new and important details about the nature of changes in CO₂ source emissions during this unique period.
Fine Particulate Matter Levels Cut in Half
Over the past seven weeks, a complex set of variables also blur the lines between “normal” fluctuations in air pollutant and greenhouse gas levels and those resulting from COVID-19 responses. For example, this week we took a closer look at how average fine particulate matter (PM₂.₅) levels changed over time, in relation to precipitation as well as the shelter-in-place order that went into effect on March 17.
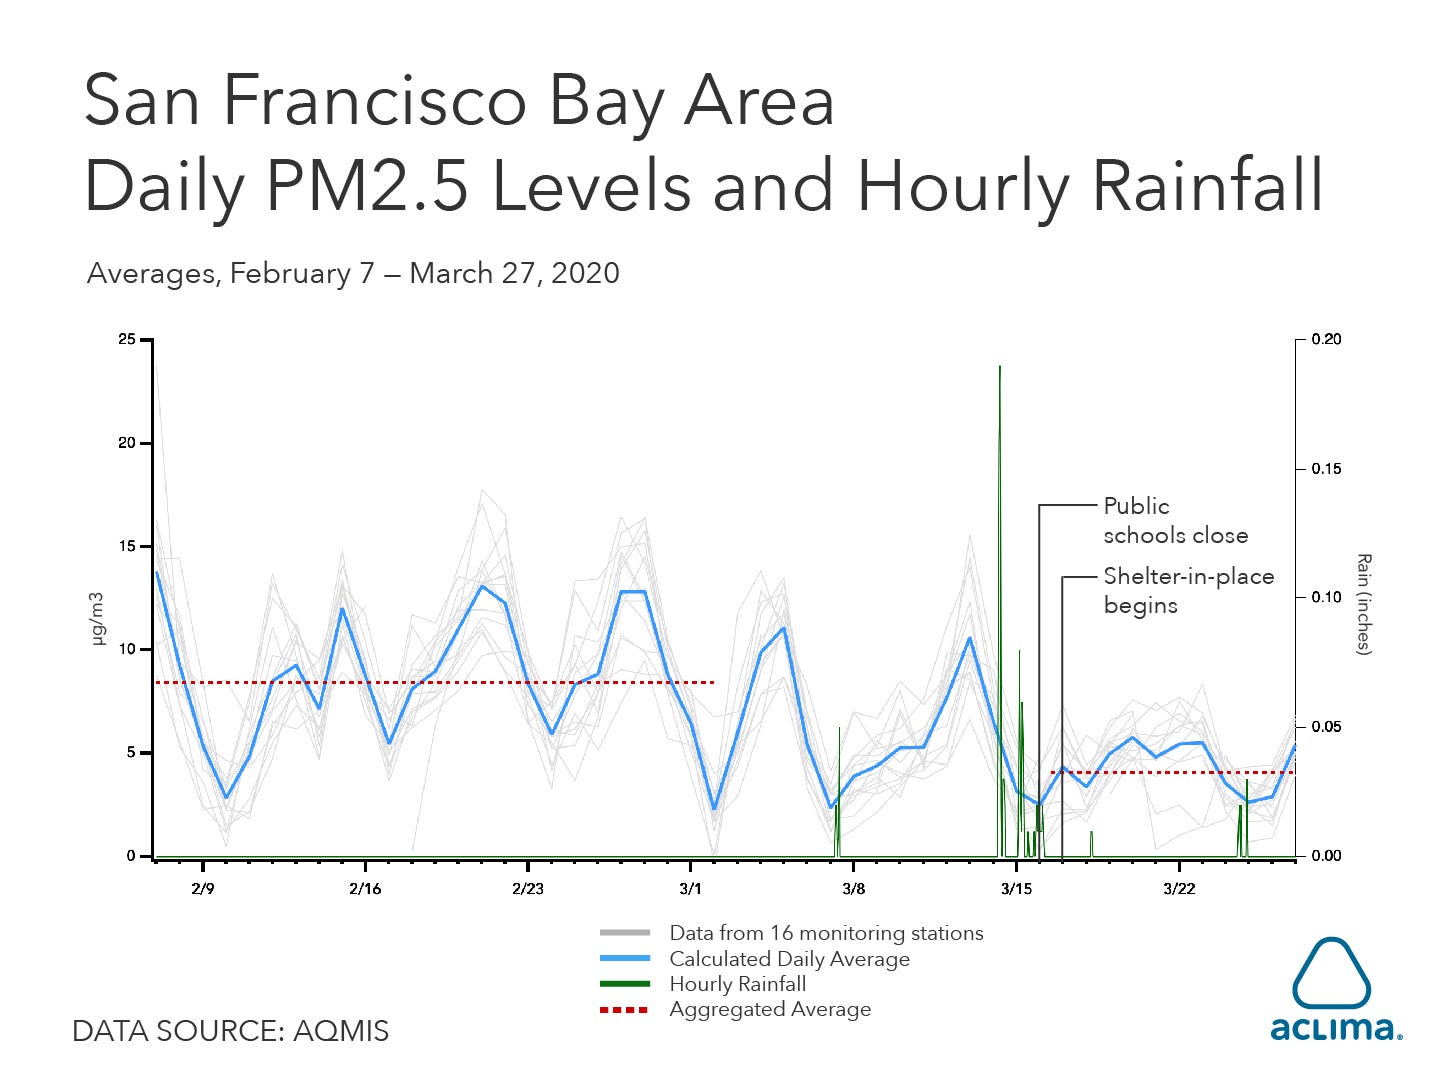
Using average PM₂.₅ in February 2020 as a reference for comparison, the average PM₂.₅ level in the Bay Area for the first two weeks of sheltering-in-place, March 17–27, decreased by half. We did not include the first two weeks in March in our comparison as this was a transition period when people started working from home but there was no Public Health Order to do so. The lowest fine particulate matter levels coincided with several rain showers, an important natural process for removing these tiny particles from the air. While rain often has this effect on PM₂.₅ levels, the halving of the average levels in the past two weeks compared to the monthly baseline in February strongly suggests a notable impact from COVID-19 responses in the Bay Area.
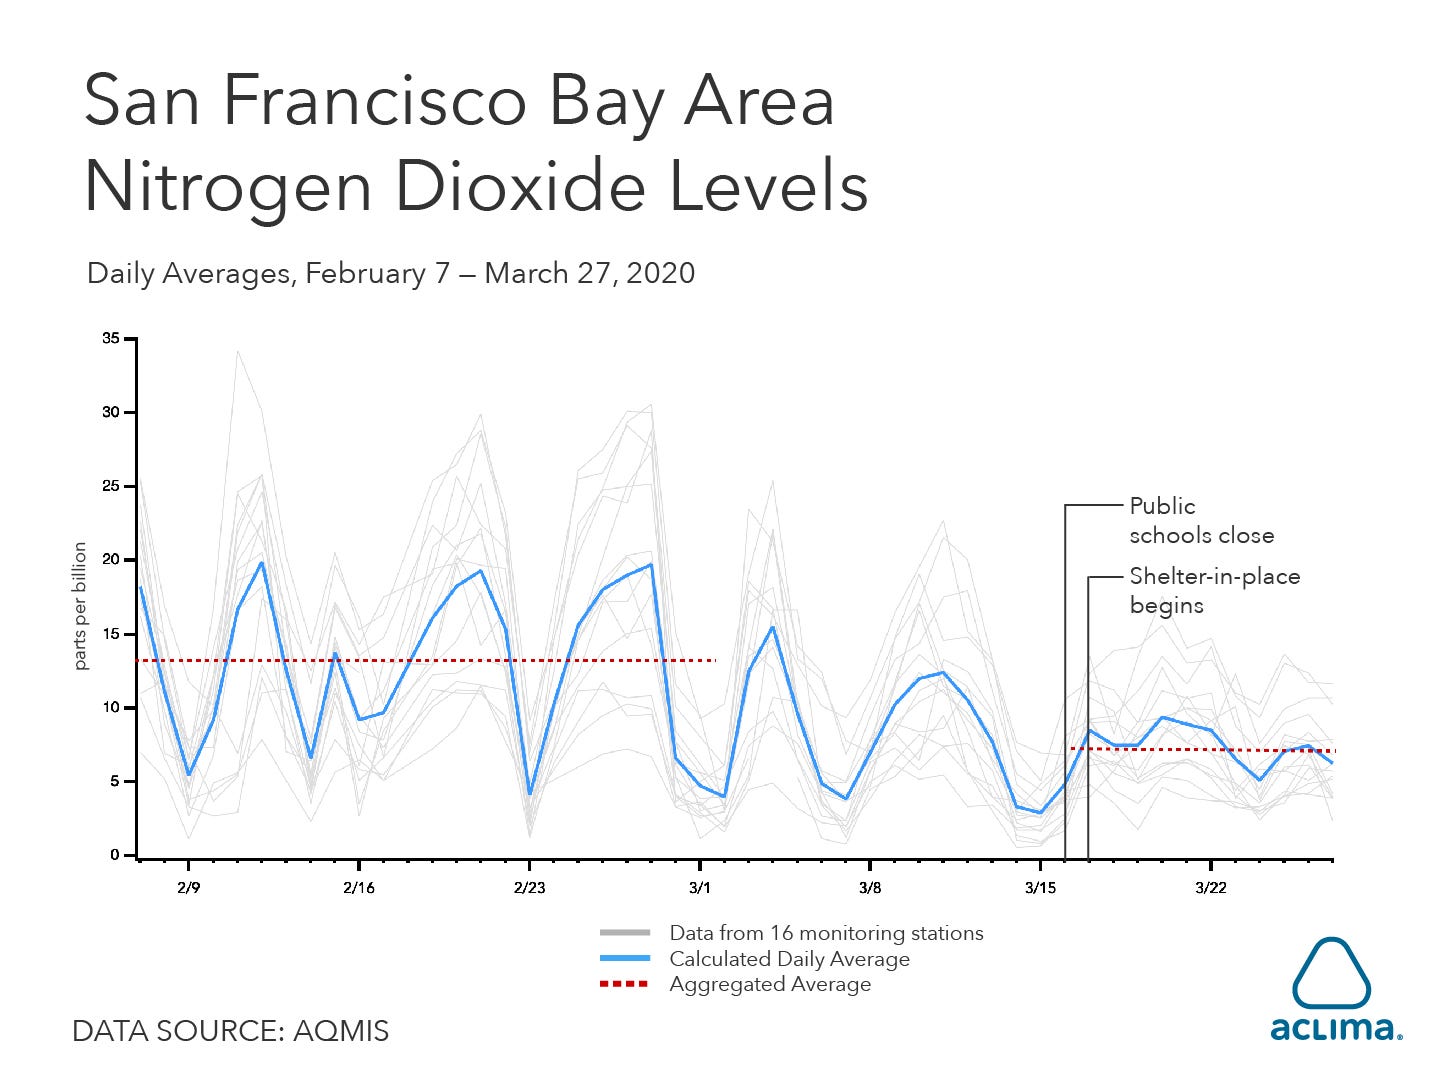
Comparing the February monthly baseline to the past two weeks, the NO₂ levels followed a similar pattern to PM₂.₅, with a noticeable decline and a flattening out, resulting in a decrease of around 40%.
The air we breathe impacts every organ in our bodies through every phase of life. Through an improved understanding of the ways that human activity impacts air pollution, how air pollution impacts human health, and how human and planetary health are intertwined, we can better protect each other and future generations.
Share this
You May Also Like
These Related Stories

Where There’s Smoke in San Francisco, There’s Fine Particulate Matter in West Oakland
The Community Becomes the Classroom
/2022_Aclima_Logo_Mist_500px_wR.png?width=501&height=193&name=2022_Aclima_Logo_Mist_500px_wR.png)
