New Interactive Report: San Diego Portside and Border Community Air Quality
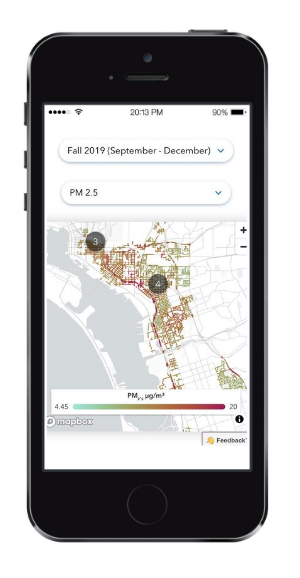
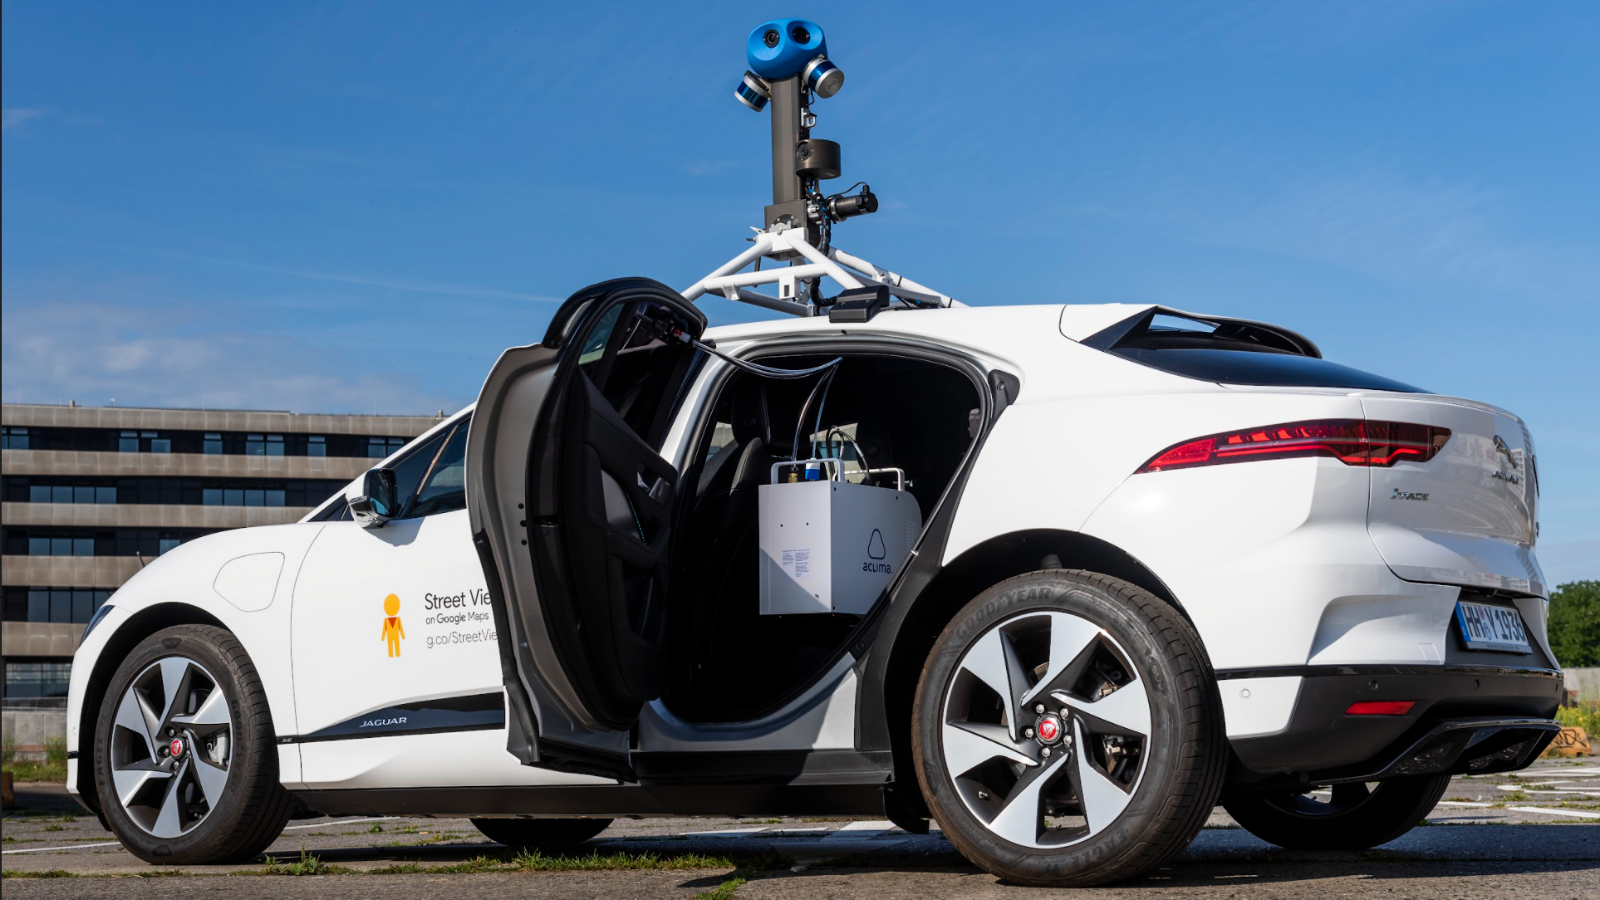
Aclima’s roving sensor network has been measuring air pollution and greenhouse gases block by block, across portside and border communities in San Diego since March 2019. Today we released an online hyperlocal air quality report sharing the seasonal averages for all measured pollutants for summer (June-September) and fall (September-December) 2019.

Drawing from more than 273 million unique data points, the report provides seasonal air quality averages for pollutants including carbon monoxide (CO), carbon dioxide (CO₂), fine particulate matter (PM₂.₅), ozone (O₃), nitric oxide (NO), nitrogen dioxide (NO₂), and black carbon (BC). Community members can look up air pollution by address across several San Diego communities including Barrio Logan, National City, Sherman Heights, Otay Mesa, and San Ysidro, as well as parts of Chula Vista and El Cajon.
Because air pollution can vary by up to 800% from one block to the next, it is important to understand where pollution tends to be higher or lower persistently, over time, at the street-level and at the regional scale. In this tool, higher average levels of pollutants are indicated in the map by a deep red color, whereas lower average levels are indicated by a pale green color. In the middle, the color scale moves from yellow to orange.
A Closer Look at Air Pollution in the Portside, Border, and Inland Areas of San Diego County
Aclima translates billions of complex measurements into environmental intelligence in support of emissions reductions and climate action to improve public health. Our platform gives people a way to compare background air quality from one block to the next and identify patterns over time, from season to season, and year to year.
In the portside and border areas of San Diego County, from spring to fall last year, we can see differences in types and levels of pollution. Some notable examples include:
-
In Otay Mesa, near the border with Mexico, there are strong signals of elevated diesel pollution, relative to the surrounding areas. These signals include comparatively higher PM₂.₅, black carbon, and NO₂ levels.
-
In San Ysidro, also near the border, there were consistently higher average PM₂.₅ concentrations in all three seasons.
-
Farther north, in Downtown San Diego — East Village, there were symptoms of elevated traffic, as indicated by elevated CO, CO₂, and NO₂.
-
Near the Port of San Diego, where Upper National City and Shelltown meet, we saw elevated average black carbon, PM₂.₅, CO, and CO₂ levels. While Upper National City averages varied seasonally, Shelltown levels were more persistently elevated across seasons.
-
In the section of El Cajon where we measured (between Jamacha and S. Mollison and south of Wells Park), there were lower levels of air pollution and greenhouse gases than the other San Diego communities we focused on.
These are just a few examples of the variation in persistent levels of pollutants in the neighborhoods Aclima measured.
Comparing Hyperlocal Air Pollution Between Seasons in Portside San Diego
Air pollution comes from a variety of sources, and many factors influence how variable or consistent pollutant levels are over time, and from one location to another. The air quality in San Diego’s Portside communities, as with many environmental justice areas, has been impacted by multiple sources of emissions for generations. These include mobile sources of emissions like passenger vehicles, diesel trucks, and airplanes, as well as stationary sources like factories, plants, and energy infrastructure. To add to the complexity of diagnosing and addressing elevated air pollution, there are seasonal influences on air quality. Changes in air temperature, humidity, hours of daylight, cloud cover, wind direction, precipitation, and even sea temperatures affect air quality.
Using the Aclima platform, our scientists compared average hyperlocal pollution across the San Diego Portside communities from one season to the next. We find that some pollutants exhibit stronger seasonal changes than others. For example, CO, which is a colorless, odorless gas emitted as a result of incomplete fuel combustion, shows little difference from spring to summer in the slider below. This suggests both limited seasonal influence and persistent CO hotspots, often concentrated near major freeways and areas of heavy traffic.
PM₂.₅ can be emitted directly from a combustion source or formed in the atmosphere from complex chemical reactions.
Unlike CO, PM₂.₅ can be made up of many different compounds. It is a category of tiny particles or drops of liquid that are 2.5 microns or less in width, 50 times smaller than a grain of sand. What defines PM₂.₅ is its size, not its substance. This all makes pinpointing sources of PM₂.₅ very difficult and determining the health impacts of PM₂.₅ complex. However, PM₂.₅ is one of the primary pollutants public health officials focus on because long-term exposure is linked to many health problems, including worsening COVID-19.
In the below slider, PM₂.₅ levels increase noticeably from summer to fall 2019 across the portside areas shown. The Tenaja and Sandalwood fires in Riverside in September and October respectively may have contributed to this generalized increase.
Still, there are noticeable pockets of elevated PM₂.₅ from one area to the next, and from one season to the next. Looking closer at differences between streets and neighborhoods in the map, there is a noticeable westward shift in higher average PM₂.₅ levels from summer to fall. This shift could be caused by a number of factors including increased incidences of wildfires, changing weather, and traffic patterns.
There is much to discover about hyperlocal air quality to inform actions to reduce those emissions and their impacts. Aclima continues to measure block by block in San Diego County in collaboration with government and community organizations, and we will continue to share what we learn with the public.
Today’s report adds to the spring 2019 San Diego hyperlocal air quality report Aclima published last year. This free online tool is available in Spanish and English. Please take a look through your browser on your laptop, mobile phone, or tablet here: insights.aclima.io/san-diego.
To learn more about the science and technology of Aclima’s hyperlocal air quality measurement and analysis platform, please visit our website at aclima.io.
Share this
You May Also Like
These Related Stories

Mapping Street-Level and Real-Time Air Quality in West Oakland

Aclima and Google Now Measuring Air Pollution and GHGs Block by Block in Hamburg

/2022_Aclima_Logo_Mist_500px_wR.png?width=501&height=193&name=2022_Aclima_Logo_Mist_500px_wR.png)
