Scientists from the U.S. Environmental Protection Agency (EPA), the Electric Power Research Institute (EPRI), Envair, and Aclima analyzed millions of block-by-block measurements (2016–2017) of air quality in Los Angeles, the San Francisco Bay Area, and California’s Central Valley with Aclima sensing technology on Google Street View cars, and confirmed that air pollution can persistently vary by six to eight times from one block to another.
In a peer-reviewed research paper published today in the Atmospheric Measurement Techniques journal entitled “Mobile-platform measurement of air pollutant concentrations in California: performance assessment, statistical methods for evaluating spatial variations, and spatial representativeness” researchers Paul A. Solomon (Retired U.S. EPA; CE1 independent consultant), Dena Vallano (U.S. EPA), Brian LaFranchi and myself (Aclima), Charles L. Blanchard (Envair), and Stephanie L. Shaw (EPRI) analyze and compare air pollution data from both mobile and stationary sensing systems.

A Mobile Air Quality Lab
Using a mobile measurement technique pioneered by Aclima and validated by its research partners and customers over the past five years, this study explored “new opportunities for characterizing spatial variations in air pollution within urban areas, identifying emission sources, and enhancing knowledge of atmospheric processes.”
The mobile air quality measurement approach used for this research incorporates a roving fleet of low-emissions vehicles equipped with fast time-response, laboratory-grade instruments that measure a variety of pollutant levels and tag them to the specific latitude and longitude where they’re taken, as well as the date, time, and weather conditions at that location.
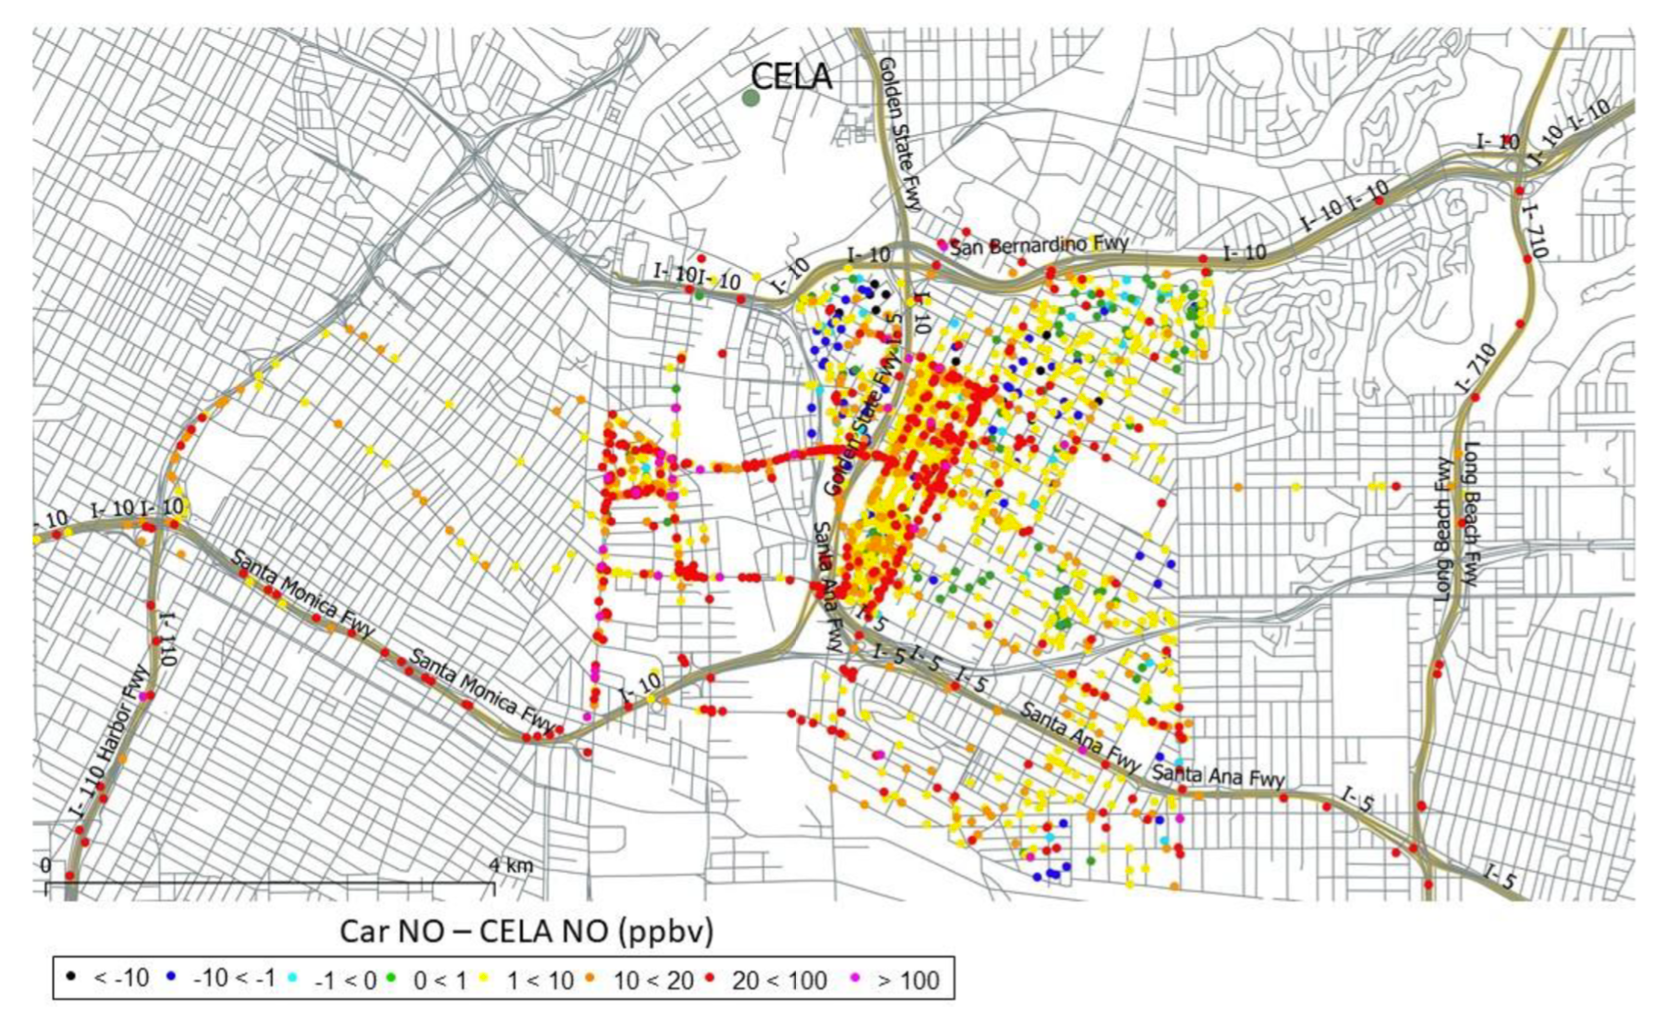
Researchers determined that Aclima’s mobile platform reliably measured nitric oxide (NO), nitrogen dioxide (NO2), ozone (O3), methane (CH4), black carbon (BC), and fine particulate matter (PN) at high (~1-second) temporal and spatial resolution. Bias and precision of 1-second time resolution data assessed via stationary audits ranged from <5% to <25% (depending on the measured pollutant). A unique data analysis examining synchronous 1-minute averaged measurements aggregated to 1-km spatial resolution enabled the characterization of spatial variations while limiting the confounding influence of diurnal (time-of-day/day-of-week) variability. This method showed 1-km spatial scale differences in NO2 of up to 117% and O3 of up to 46% over a two week sampling period, demonstrating that aspects of spatial variability can be measured over relatively short deployment times.

Comparing Mobile and Stationary Spatial Representativeness
Each instrumented vehicle is essentially a mobile air pollution lab that can measure air pollutant levels block-by-block, giving researchers a highly detailed picture of changing pollutant levels at different points in space. In comparison, government regulators construct stationary monitors with large, specialized equipment in permanent, fixed positions that give researchers, air quality regulators, and the public a highly detailed picture of changing pollutant levels at different points in time. In essence, mobile measurement travels through the pollutants and pollutants travel past stationary monitors.
Mobile and stationary measurement techniques complement one another. And in this study, the researchers assessed whether they also reliably corroborate one another. In short, they do.
In this study, comparing mobile data and regulatory site data confirmed the representativeness of both methods. Furthermore, the study concluded that mobile air quality measurement has higher spatial resolution while maintaining precision and accuracy relative to stationary regulatory sites.
How Air Pollution Varies Block-to-Block
Collocated measurements in Los Angeles, the Bay Area, and California’s Central Valley showed differences of less than 20% between paired or two “co-located” mobile measurements, suggesting differences of more than 20% represent spatial variability of air pollutant levels. Essentially, the findings indicate that mobile air quality monitoring provides hyperlocal spatial representativeness showing large variations in pollutant concentrations at 100–300 meters. These calculations are made by averaging 60 one-second measurements into a one-minute average.
City blocks in the United States are on average 100 to 200 meters in length. Thus, the mobile data confirms that pollutant levels can be simultaneously 6 to 8 times higher just blocks apart.
The authors conducted this work using a dataset that Aclima and Google released to the scientific community in 2018, which is part of a massive hyperlocal California air quality dataset released to the scientific community last week. Today’s study confirms the hyperlocal spatial variability of air pollutants in multiple locations throughout California. In 2017, we reported the observation of this block-by-block variability in West Oakland in an Environmental Science & Technology paper with research collaborators from UT Austin, EDF, UBC, LBNL, UW, and Utrecht University.
Today’s publication is the latest in a body of research that indicates the reliable, precise, and accurate performance of Aclima’s mobile platform. The resulting insights also further the science of air quality measurement with both mobile and stationary approaches. A publication earlier this month, again in Environmental Science and Technology, showed that spatial coverage from mobile monitoring reveals patterns in average Black Carbon levels not captured by stationary measurements made at an extremely high density of ~7 sites per km2 over an approximate 3-month time period.
This new research reinforces that air quality can differ significantly from one block to the next. People living in close proximity can have different levels of exposure to pollutants in the air they breathe. From a health perspective, this highly resolved data can generate granular, place-based, and cumulative exposure maps that are of interest to people managing chronic health conditions such as heart disease, asthma, and kidney disease.
Continued research is needed in this important field as air pollution and the emissions that cause it are harming human health and changing our climate. To mitigate this damage and chart a course toward a healthier, more resilient, and more equitable future, we must invest in science-based solutions.
Research scientists can apply for access to the complete Aclima and Google air quality dataset here.
By Melissa Lunden, Chief Scientist, Aclima
/2022_Aclima_Logo_Ocean_500px_wR.png)