Science
Delivering quality air data and insights rooted in science
Mapping pollution for action
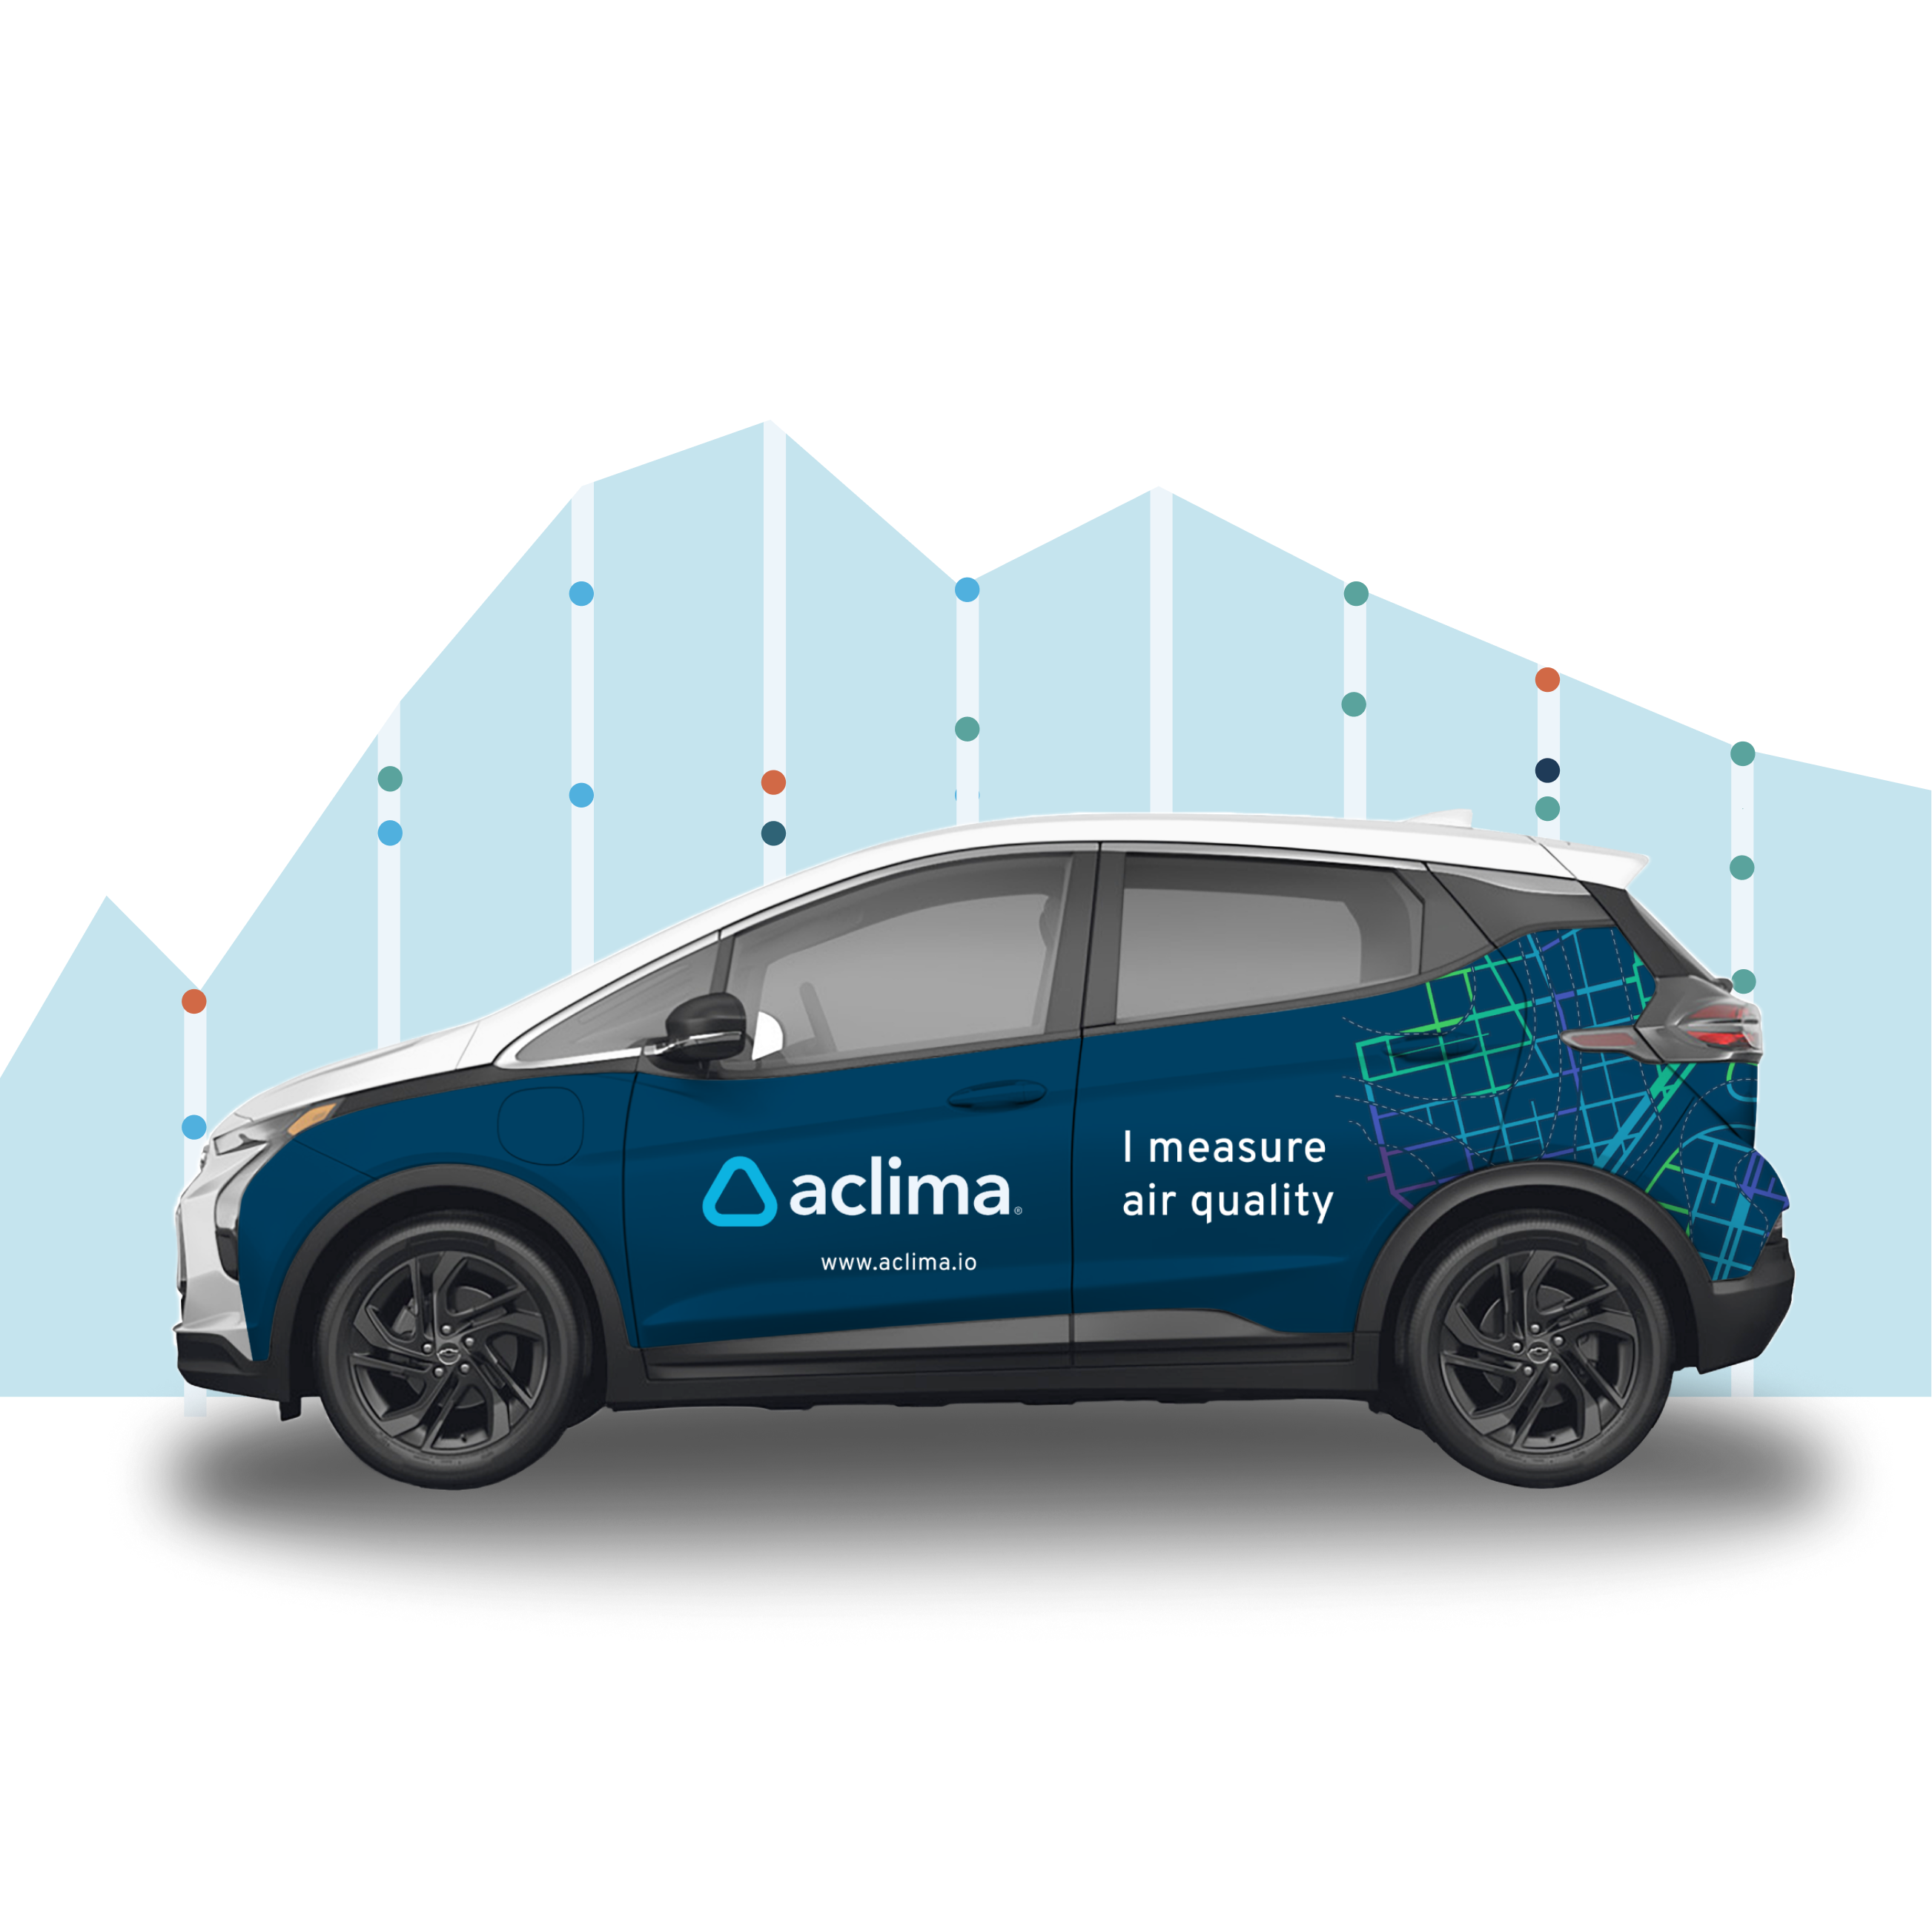
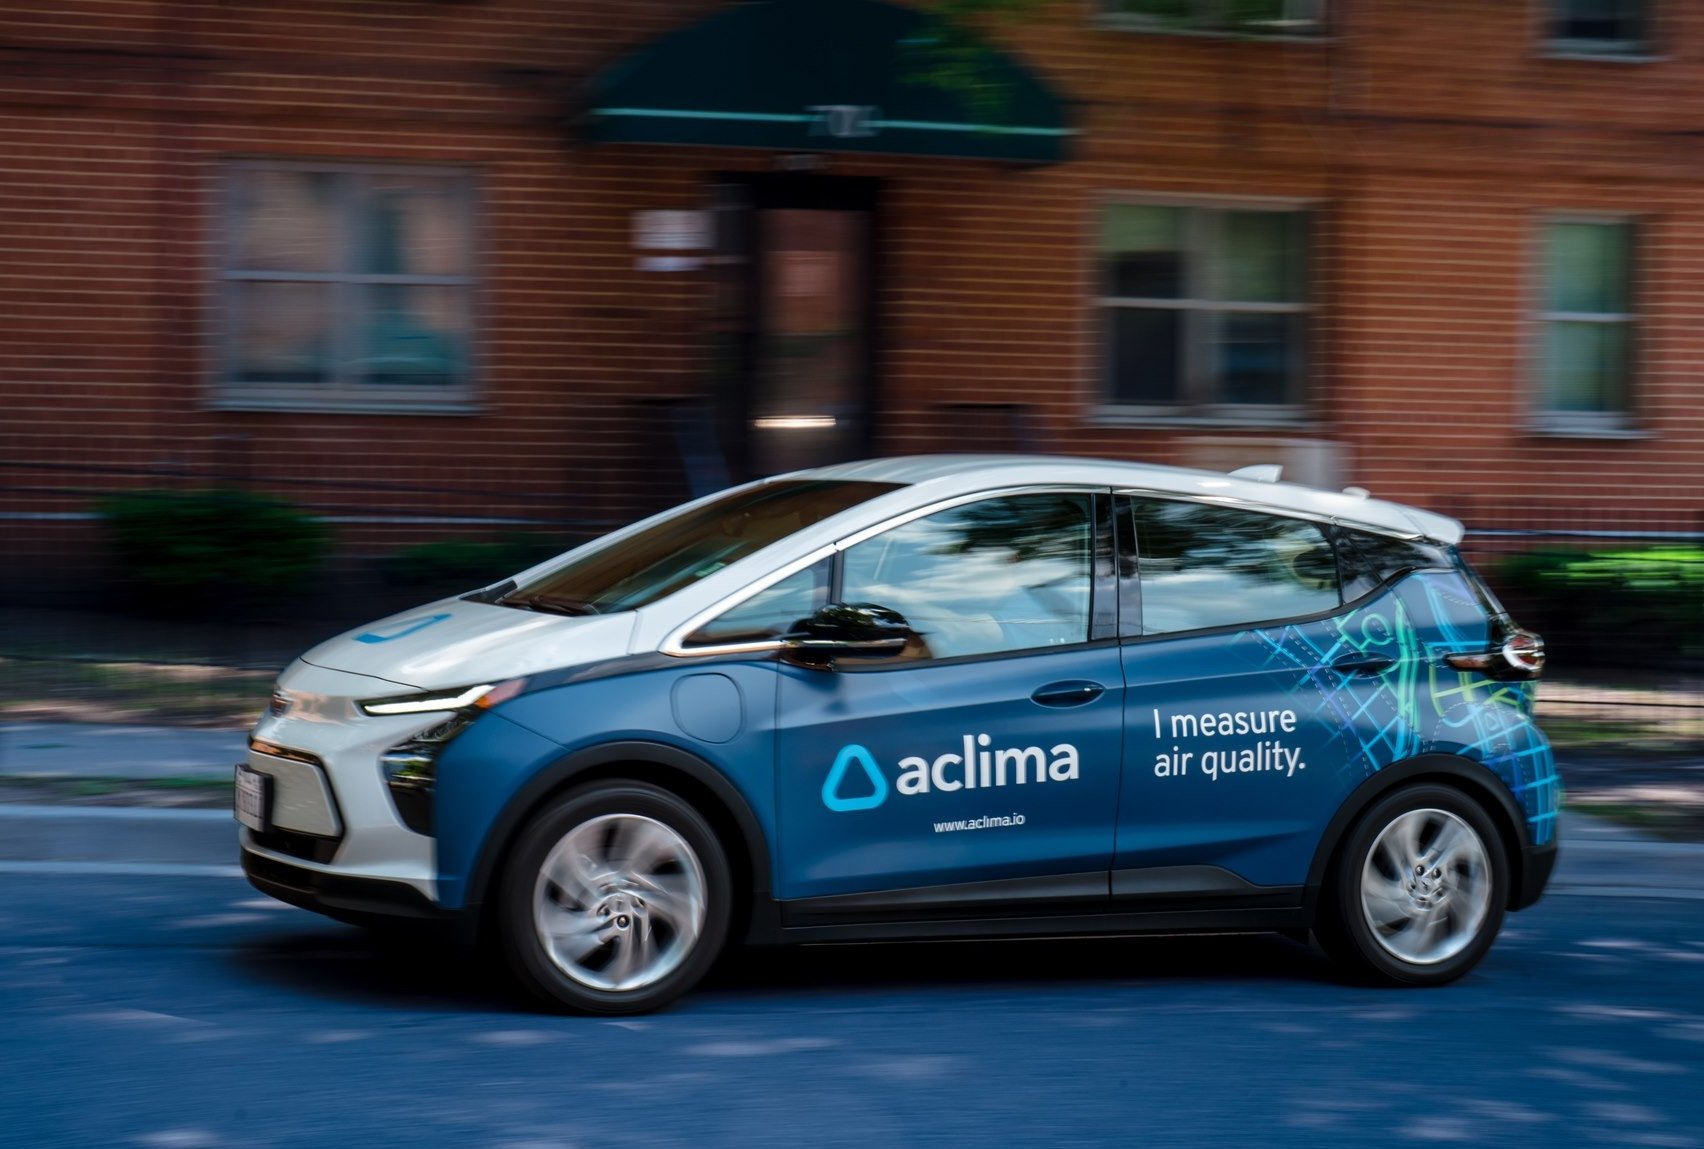
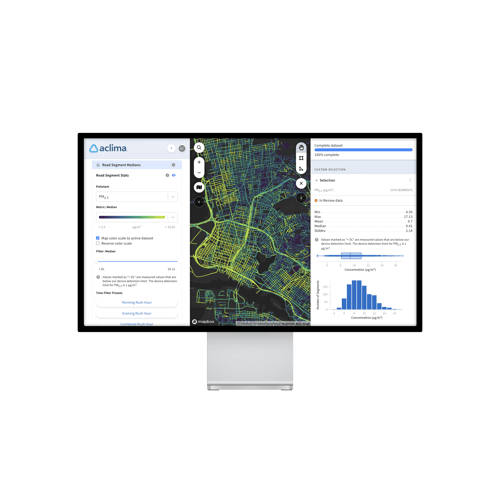
Mobile monitoring is a powerful new approach to measuring and understanding air quality. Aclima's fleet collects air quality and climate pollution measurements within neighborhood blocks and across entire communities using rigorous quality assurance and control standards. We analyze and compile those data into interactive maps to help our customers enact equitable clean air action plans.
Our methods are driven by the best available science, much of which was developed by our team of air quality scientists, engineers, and technicians in partnership with leading experts in government and academia. Explore our publications ->
What we measure
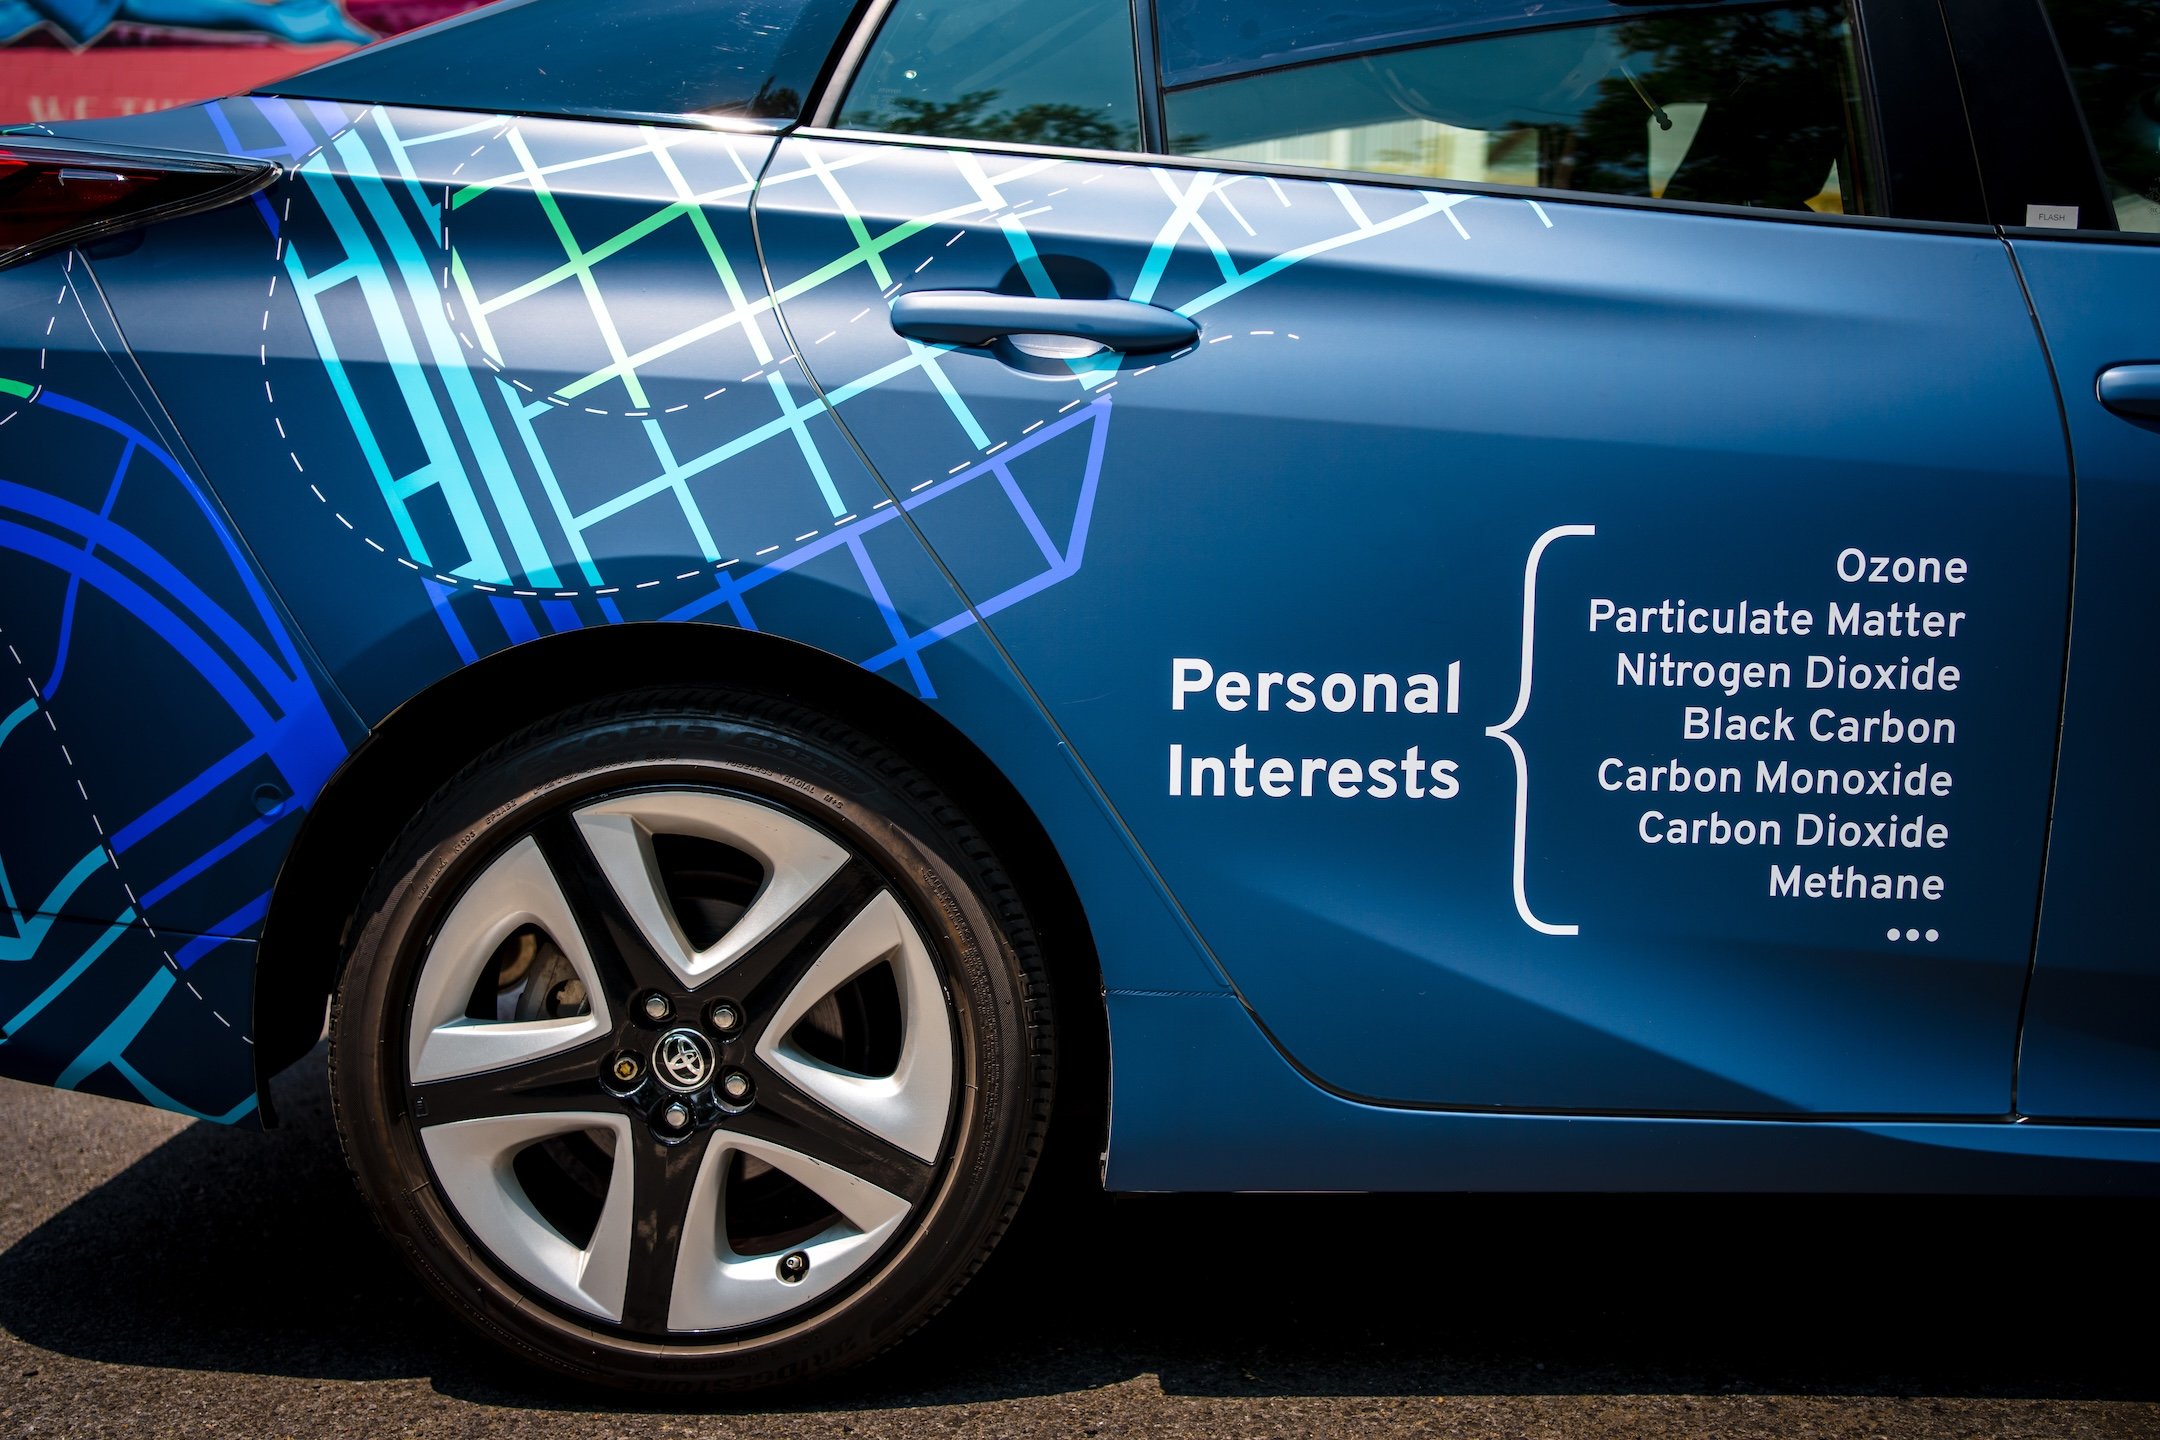
fine particulate matter (PM2.5) • ozone (O3) • nitrogen dioxide (NO2) • methane (CH4) • carbon monoxide (CO)
carbon dioxide (CO2) • black carbon (BC) • total volatile organic compounds (TVOCs) • benzene, toluene, ethylbenzene, and xylenes (BTEX)
How we map air


Air disparities in the Bay Area
Results from the first major application of Aclima's Community Impact and Investment Index across all 101 cities in the San Francisco Bay Area leveraging Aclima air pollution data from the largest region-wide mobile sensor network.
Ensuring data quality
Data quality is a top priority for Aclima’s science team – we know that in order to use our data to inform action, decision makers need to be able to trust that they have gone through a rigorous series of scientific checks and balances.
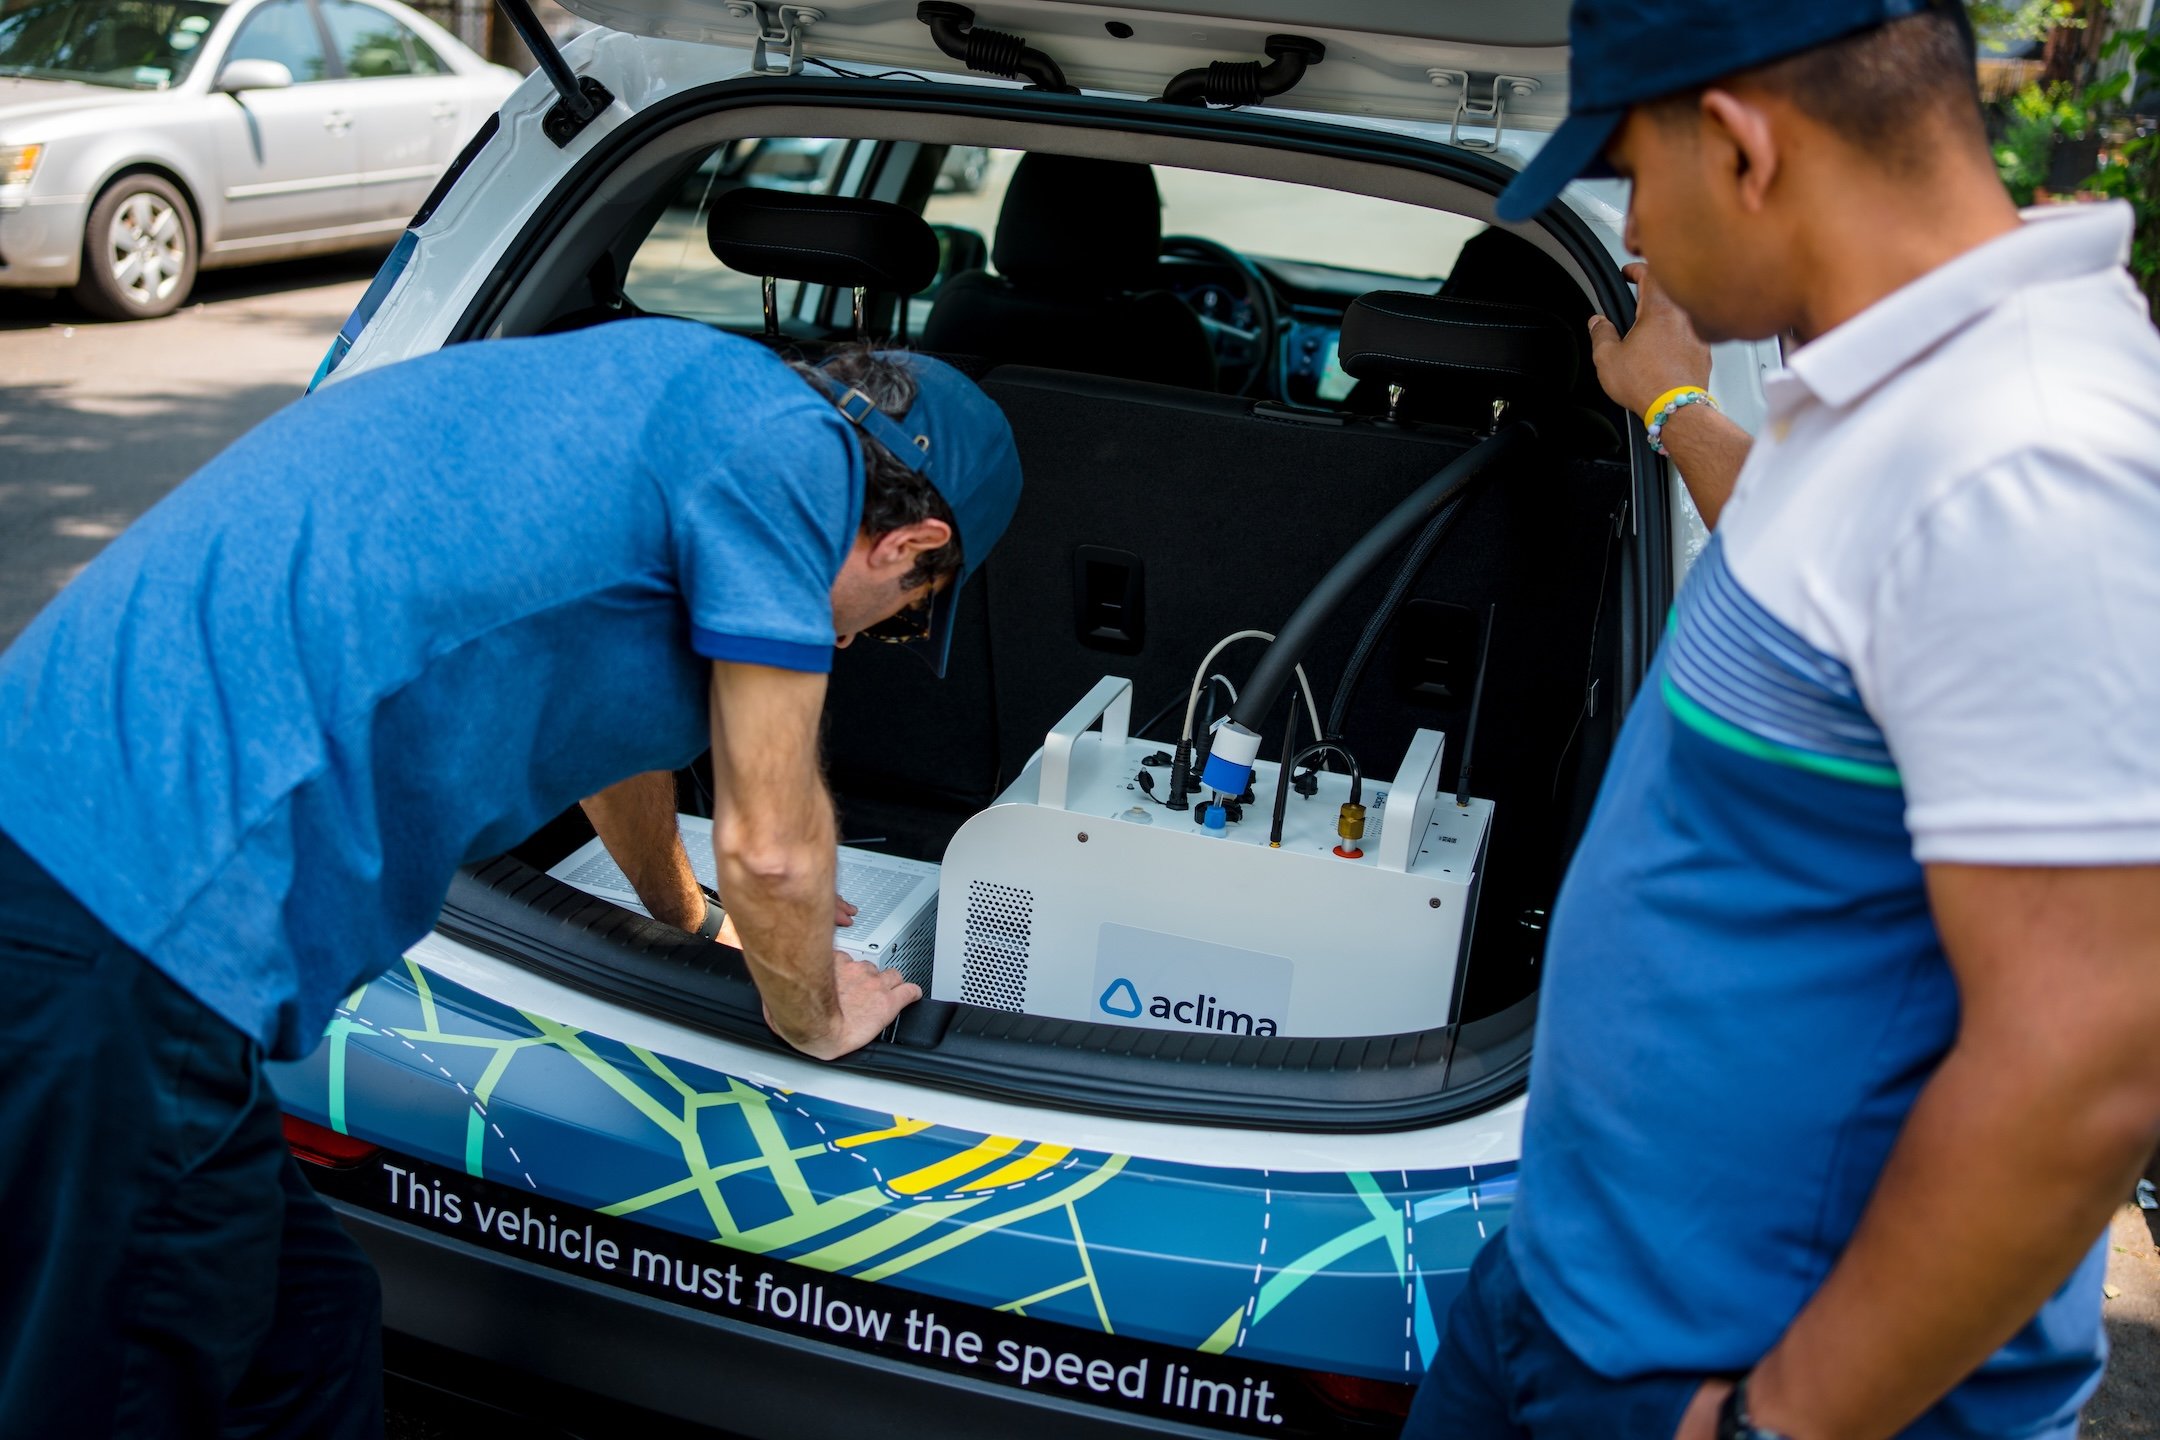
Aclima’s Quality Assurance system was developed to ensure all the processes that go into the creation of our hyperlocal maps support their use by communities and regulators for decision-making.
Aclima's Quality Assurance System
Our approach to designing a quality assurance system includes:
Performance
Confidence
Characterizing uncertainty
Introduction and Management
Explains how to understand overall uncertainty in mobile data, data quality objectives, and how measurement techniques inform quality assurance approaches.
Mobile Ambient Air Pollution Measurement Quality Assurance System
Describes mobile monitoring methods, equipment, and sampling methodology, as well as information on sensor calibration and data review processes.
Hyperlocal Ambient Concentration Estimate Validation and Quality Assurance System
Outlines procedures for analysis of verified data to produce hyperlocal maps of ambient concentration estimates, as well as validation and verification processes.
Science partnerships
Aclima partners with leading air quality scientists, researchers, and engineers to advance the development of cost-effective, scalable mobile monitoring solutions.
Aclima has long-standing or past partnerships with academic institutions such as UC Berkeley, the University of Washington, and the University of Texas, as well as research collaborations with the United States Environmental Protection Agency (EPA). These partnerships have helped refine our methodologies and ensure scientific rigor in all our work.
Peer-reviewed papers
High-resolution air pollution mapping with Google Street View cars: exploiting big data
Environmental Science and Technology, June 2017
Mapping Air Pollution with Google Street View Cars: Efficient Approaches with Mobile Monitoring and Land Use Regression
Environmental Science and Technology, November 2018
Uncertainty in collocated mobile measurements of air quality
Atmospheric Environment X, 7, 2020
Mobile-Platform Measurement of Air Pollutant Concentrations in California: Performance Assessment, Statistical Methods for Evaluating Spatial Variations, and Spatial Representativeness
Atmospheric Measurement Technologies, 12, 3277-3301, 2020
Comparison of Mobile and Fixed-Site Black Carbon Measurements for High-Resolution Urban Pollution Mapping
Environmental Science and Technology, 54 (13), 7848-7857, 2020.
Local and regional-scale and ethnic disparities in air pollution determined by long-term mobile monitoring
Proceedings of the National Academies of Sciences, Sept 2021
Spatiotemporal profiles of ultrafine particles differ from other traffic-related air pollutants: Lessons from long-term measurements at fixed sites and mobile monitoring
Environmental Science: Atmospheres 28 Sept 2021
High-resolution mapping of traffic related air pollution with Google street view cars and incidence of cardiovascular events within neighborhoods in Oakland, CA
Environmental Health, 17:38, May 2018
Fine-Scale Spatiotemporal Air Pollution Analysis Using Mobile Monitors on Google Street View Vehicles
Journal of the American Statistical Association, Oct. 2019
Assessing the Distribution of Air Pollution Health Risks within Cities: A Neighborhood-Scale Analysis Leveraging High-Resolution Data Sets in the Bay Area, California
Environmental Health Perspectives, 129(3), March 2021
Hyper-localized measures of air pollution and risk of preterm birth in Oakland and San Jose, California
International Journal of Epidemiology, 2021
A quantitative, equitable framework for urban transportation electrification: Oakland, California as a mobility model of climate justice
Sustainable Cities and Society, 2021
How does air pollution influence housing prices in the Bay Area?
International Journal of Environmental Research and Public Health, 2021
Personal CO2 bubble: Context-dependent variations and wearable sensors usability
Journal of Building Engineering, March 2019
Personal CO2 cloud: laboratory measurements of metabolic CO2 inhalation zone concentrations and dispersion in a typical office desk setting
Journal of Exposure Science and Environmental Epidemiology, Oct 2019
Effects of Office Workstation Type of Physical Activity and Stress
Occupational & Environmental Medicine, Aug. 2018
Wellbuilt for wellbeing: Controlling relative humidity in the workplace matters for our health
Indoor Air: Oct., 2019
Indoor environmental quality and learning outcomes: protocol on large-scale sensor deployments in schools
BMJ Open 2020

